

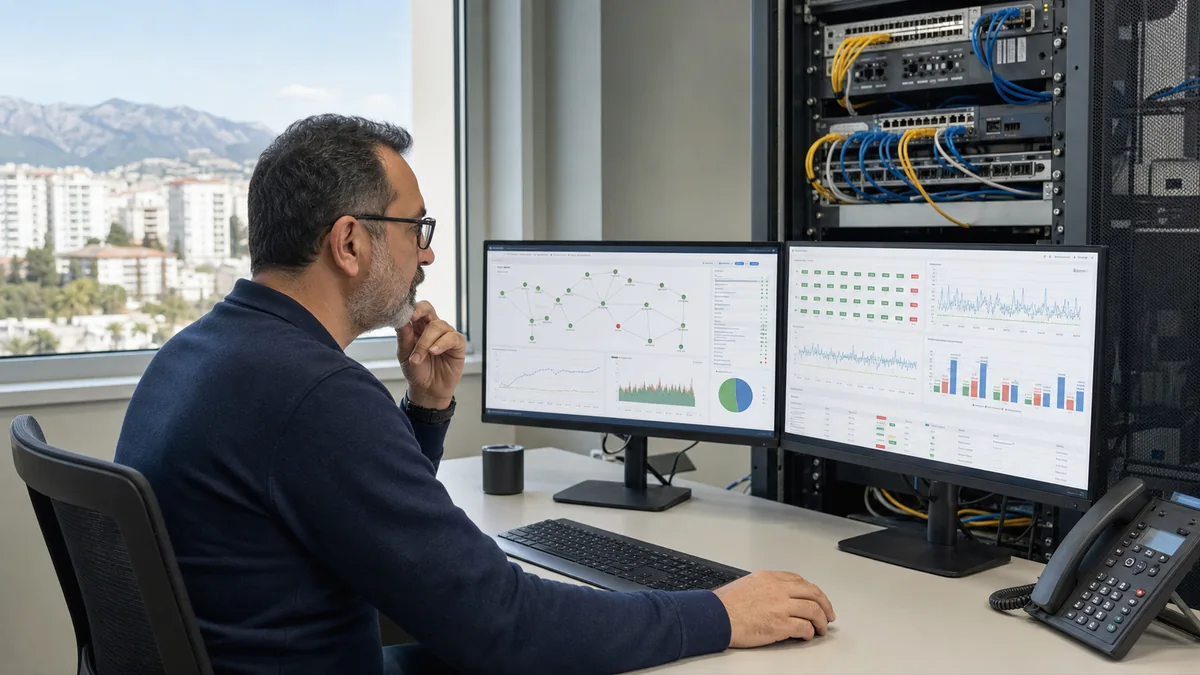
Inventory-led monitoring, useful alerts and documented handover
Zabbix Network Monitoring Setup and Management
We design Zabbix around business-critical systems, secure data collection, realistic capacity, controlled discovery and alerts that have an owner and an action.
Plan Your Zabbix DeploymentMonitoring with an operating purpose
A Zabbix project starts with services and ownership, not a blank dashboard
Zabbix is an enterprise-grade open-source monitoring platform that can collect availability and performance data from networks, servers, applications, databases, virtual systems and services. A useful deployment identifies what the business depends on, how each signal will be collected, which conditions require action, who receives the event and what evidence must remain available for troubleshooting and capacity planning.
Architecture
Four layers that must be sized and secured together
Zabbix server
The central service receives data, evaluates triggers, processes events and sends notifications. Process load and cache health are included in capacity planning.
Database and retention
History, trends, events and configuration depend on database performance, housekeeping, retention and backup. Storage growth is estimated from the real item plan.
Frontend and access
Dashboards, configuration and reports are presented through the web interface. Roles, authentication, administration paths and secure publication are designed deliberately.
Agents, proxies and protocols
Agents, SNMP, ICMP, APIs, web checks, logs and proxies collect data. Credentials and network access follow least-privilege and segmentation requirements.
Templates and discovery
Templates standardise items, triggers and graphs. Discovery and low-level discovery are constrained so useful coverage does not become uncontrolled load.
Alerts and integrations
Dependencies, maintenance, severities, recovery logic, message content, channels, ticketing and escalation are aligned with operational ownership.
Distributed monitoring
A proxy can simplify remote collection without moving event ownership
Zabbix documentation describes a proxy as a component that collects performance and availability data on behalf of the central server. It is useful for branches, networks behind firewalls, unreliable links and larger deployments where collection load should be distributed. The proxy can buffer data locally during a temporary communication problem and then forward it when connectivity returns.
A proxy is still a data collector. Trigger calculation, event processing and notifications remain on the Zabbix server. Proxy placement, database, buffer mode, connection direction, encryption, monitored hosts and recovery after a link outage are therefore documented and tested.
Capacity and coverage
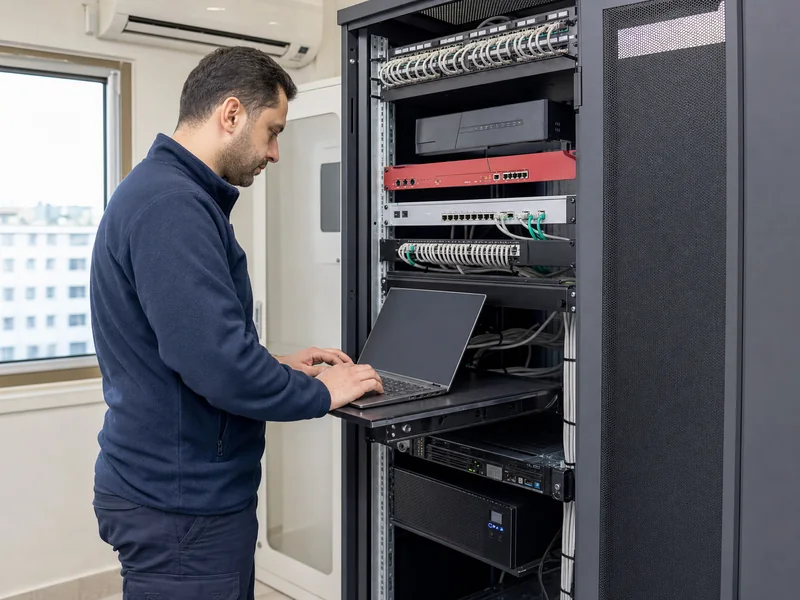
Host count alone does not define the platform
Items and collection interval
The number of values, polling frequency, active and passive checks and preprocessing determine how much work the platform performs.
Values processed per second
Expected and peak data rates help size server processes, caches, proxies and the database more accurately than a host total.
History, trends and events
Retention requirements affect storage, backup, housekeeping and report performance. Not every item needs the same detailed history period.
Triggers and dependencies
Complex expressions, repeated events and missing dependencies can increase processing and alarm noise even when the inventory is modest.
Practical note: a small number of hosts with very frequent application and log checks can create more load than a larger inventory using lightweight availability and SNMP checks.
Delivery process
Six controlled stages to an operable monitoring platform
- 01
Inventory and business services
Hosts, interfaces, applications, dependencies, owners, locations, maintenance windows and critical service paths are recorded.
- 02
Server and database design
Items, intervals, retention, values per second, storage, backup, frontend, high availability needs and growth are estimated.
- 03
Secure data collection
Agents, SNMP, APIs, web checks, proxy placement, encryption, credentials, firewall rules and least-privilege access are defined.
- 04
Templates and discovery pilot
Representative devices are tested before templates, auto-registration and discovery rules are applied more widely.
- 05
Alert and dashboard design
Triggers, dependencies, maintenance, severity, recovery, message content, notification channels and owner views are validated.
- 06
Acceptance and handover
Coverage, missing data, alert delivery, proxy outage, backup, restore approach, user roles, runbooks and open items are reviewed.

Alert quality
The goal is not more alerts, but earlier and clearer action
Monitoring loses value when every symptom creates a separate message. Network and service dependencies suppress secondary events when an upstream component fails. Maintenance periods prevent expected work from creating incidents. Delay, hysteresis and recovery logic reduce short-lived noise without hiding sustained problems.
Messages include the affected service, location, current value, threshold, duration, related dependencies and a link or instruction for investigation. Escalation follows the service owner and coverage model. A dashboard is then a shared operational view, not a substitute for responsibility.
Operating model
Platform ownership and incident response are defined separately
Customer-operated platform
We install, configure, test and document the system. The customer's IT team owns daily events, user access and ongoing changes after handover.
Co-managed Zabbix
Responsibilities are divided for templates, onboarding, platform health, tuning, dashboards, reporting and periodic technical review.
24/7 NOC service
Continuous review requires a separate scope for monitored services, escalation contacts, coverage, response actions, communication and reporting.
Planning input
What to send for a Zabbix scope review
- Inventory and locations
- Hosts, networks, interfaces, operating systems, applications, virtual systems, branches and critical service relationships.
- Collection requirements
- Required metrics, intervals, logs, SNMP versions, agents, APIs, credentials, network restrictions and proxy candidates.
- Retention and reporting
- History, trend, event and audit expectations together with dashboard, report and integration needs.
- Operations
- Service owners, maintenance windows, notification channels, escalation contacts, coverage hours and handover expectations.
Frequently asked questions
Zabbix Network Monitoring Setup and Management FAQ
What can Zabbix monitor?
Zabbix can monitor network devices, servers, operating systems, applications, databases, virtual platforms, cloud services, logs and service endpoints through agents, SNMP, ICMP, APIs, web checks and other supported collection methods.
When is a Zabbix proxy useful?
A proxy is useful for remote sites, networks behind firewalls, unreliable links and larger environments where collection load should be distributed. It collects data locally and forwards it to the central server, while event processing and alerting remain central.
Is device count enough to size a Zabbix server?
No. Sizing also depends on item count, collection interval, values processed per second, history and trend retention, trigger complexity, preprocessing, database performance, proxy design and reporting expectations.
Can automatic discovery be enabled for the whole network?
It can be used, but uncontrolled discovery may create excessive items, noise and load. Discovery ranges, credentials, templates, low-level discovery rules and exclusions should be tested in a pilot before broad rollout.
How are Zabbix alerts made useful?
Useful alerting starts with service ownership, dependencies, maintenance periods, severity rules, delay and recovery logic, notification channels and escalation contacts. Every important alert should identify who acts and what evidence they need.
Is Zabbix platform management the same as 24/7 NOC service?
No. Platform management keeps the monitoring system, templates, collection and alert logic healthy. A 24/7 NOC service additionally requires continuous event review, escalation rules, contact coverage and agreed response responsibilities.
Can Zabbix services be provided across Turkey?
Yes. Design, installation, remote-site proxy work, template development, dashboarding and management can be delivered remotely across Turkey when secure access is available. On-site work can be planned for Antalya and project locations that require physical verification.
Official technical references
- Zabbix current documentation: introduction
- Zabbix current documentation: proxy
- Zabbix current documentation: configuration best practices
Technical review date: . Supported versions, platform requirements and product behaviour are rechecked before implementation.
Discuss Your Requirements with Biga Bilisim
Send the company name, location, current environment, required outcome and preferred timeline. We will review the request and define the most practical next step.